This is the mobile-friendly web version of the original article.
Illicit Activity Detection in Large-Scale Dark and Opaque Web Social Networks
Georgia State University
ScholarWorks @ Georgia State University
EBCS Articles, Evidence-Based Cybersecurity Research Group
Dhara Shah
Georgia State University
Linkedin
T. G. Harrison
Georgia State University
Christopher B. Freas
Georgia State University
Website
David Maimon
Georgia State University
Website
Robert W. Harrison
Georgia State University
Linkedin
Video: Georgia State University Campus Tour
Part of the Criminology and Criminal Justice Commons, Defense and Security Studies Commons, and the Information Security Commons
Recommended Citation
Shah, Dhara; Harrison, T. G.; Freas, Christopher B.; Maimon, David; and Harrison, Robert W., “Illicit Activity Detection in Large-Scale Dark and Opaque Web Social Networks” (2021). EBCS Articles. 20. https://scholarworks.gsu.edu/ebcs_articles/20
This Article is brought to you for free and open access by the Evidence-Based Cybersecurity Research Group at ScholarWorks @ Georgia State University. It has been accepted for inclusion in EBCS Articles by an authorized administrator of ScholarWorks @ Georgia State University. For more information, please contact [email protected].
- Christopher B. Freas
- David Maimon
- Robert W. Harrison
- Abstract
- I. INTRODUCTION
- II. EXISTING TEXT TO VECTOR TRANSFORMATION METHODS
- IV. METHODS
- V. RESULTS
- VI. CONCLUSIONS
- VII. ACKNOWLEDGEMENTS
- REFERENCES
Abstract
Many online chat applications live in a grey area between the legitimate web and the dark net. The Telegram network in particular can aid criminal activities. Telegram hosts “chats” which consist of varied conversations and advertisements. These chats take place among automated “bots” and human users. Classifying legitimate activity from illegitimate activity can aid law enforcement in finding criminals. Social network analysis of Telegram chats presents a difficult problem. Users can change their username or create new accounts. Users involved in criminal activity often do this to obscure their identity. This makes establishing the unique identity behind a given username challenging. Thus we explored classifying users from their language usage in their chat messages.
The volume and velocity of Telegram chat data place it well within the domain of big data. Machine learning and natural language processing (NLP) tools are necessary to classify this chat data. We developed NLP tools for classifying users and the chat group to which their messages belong. We found that legitimate and illegitimate chat groups could be classified with high accuracy. We also were able to classify bots, humans, and advertisements within conversations.
Index Terms—Telegram, Criminal Networks, Statistical Modeling, Machine Learning, Doc2Vec, TF-IDF
I. INTRODUCTION
Telegram is a social networking service comparable to but distinct from Twitter. Users of Telegram are semi-anonymous. This anonymity can conceal criminal activities. Examples include identity fraud, drug trade, bank fraud, and animal cruelty. Users also engage in innocuous activity such as Python programming discussions. Unique identification of a user enables attribution of message content to that user. This enables the discovery of relationships between different activities. User identification and relationship discovery are important efforts in criminology and sociology. This paper applies statistical learning and natural language processing techniques. These are used to create efficient tools for user attribution.
This paper aims to develop efficient approaches to identify high-information words in a corpus of text. This allows the separation of one set of text from another with the aim of attributing authorship and general purpose to the texts. The goal of this work is to attribute authorship and group membership rather than to interpret the meaning of the text. Therefore it is important to preserve the idiomatic nature of the texts.
The classic methodology for designing such an NLP classifier is to clean the data for English, create a word dictionary, convert the sentences to one-hot vectors to use a word and a sentence embedding strategy and vectorize text, and use a classifier to classify the texts. Instead, we bypass the embedding by choosing the relatively high information words and creating a feature dictionary with these. We then use binary classification directly on the count hot vectors created by this dictionary. Moreover, the only data cleaning we use here is to replace non-alphanumeric characters by blank spaces and remove stranded/single characters (i.e. words of length 1). We do not remove any words besides these.
We list our contributions as following: implementing a novel word selection strategy that makes for better features, and hence in turn simplifies the classification pipeline for two text classes. Through this strategy, we can handle much larger volume of test data to be classified by processing the heterogeneous text data in near real time.
A. Criminology
Previous work by criminologists has shown that dark net users choose encrypted platforms such as Telegram, Signal, and Jabber for communicating with each other [1]. Telegram is a Russian individual and group messaging service that was founded in 2013. The servers hosting the Telegram service are based in the Middle East. As such it is difficult or impossible for U.S. and Western prosecutors to acquire server-side chat records. While the majority of users are engaged in entirely lawful activities a growing criminal element has taken root. We use the term “opaque” to describe these activities, where users deliberately obfuscate their identities to hide their activities.
Individual groups set up their own channels or chat rooms to deal in their area of expertise. Other groups establish exchanges where services and products may be bartered, for example “sim farms” to fake credentials [2]. User reputation is critical for establishing connections and sales [3]. Therefore establishing computational tools that can track users and their social networks is important [4]. There exists a great deal of overlap between groups, with individual criminals active in multiple groups at any given time as well as the more formal dark web markets.
Within these illicit networks there exists criminal jargon which is unique to the type of crime being committed. Our work focuses on financial and white-collar crime. Thus we frequently see terms like “fullz” (credit card information), or “dumps” (personally identifiable information). These terms are directly related to the types of financial crime being committed in any given group chat.
B. Telegram Scraping Approaches
Telegram is accessible both through a traditional web browser interface and through their mobile app. An Application Programming Interface (API) is available, however its use is mostly restricted to Telegram-approved bots. The data were scraped by logging into each group and downloading the HTML formatted history of the group chat. The HTML was then parsed as described in section IV-C.
C. Telegram Language
The Telegram data differ from most text data sets in two important ways. First it is highly idiomatic, where the idiomatic language varies from group to group. Second, the messages tend to be short, which raises sampling issues where keywords are missed in a small sample, when the messages are analyzed.
Individual groups employ their own slang, lingo, or cryptolect when they communicate amongst themselves. This is both a measure of inclusion or group membership and a reflection of individual linguistic idiosyncrasies. Groups also can employ their own cryptolect, words, and phrases unique to their criminal activities to intentionally cloak themselves from inspection [5], [6]. “Thieves cant” and Cockney rhyming slang are classic examples of this linguistic process. Traditional NLP approaches, like Word2Vec and Doc2Vec [7], [8], indicate that these terms would be the most feature rich. However many of these methods are based on large, clean data sets of standard English, such as newspaper articles or literary works which limits their applicability with non-standard English.
Telegram messages are typically short with respect to the total vocabulary used in a channel. The short message length gives rise to the issue of sample selection. In terms of short sentences most NLP research has focused on sentiment analysis, often using Twitter data [9], [10], [11]. Each message takes a sample of the total vocabulary. When a subset of the words is used in machine learning as a set of features to identify a message source, the messages may not have instances of each member of the feature set. These zeros are relatively non-informative and lead to errors in the machine learning. In our ad detection we found that messages above a certain length, about 200 words, were all but guaranteed to be ad spam. Since the fraction of words chosen is an arbitrary and adjustable parameter, we chose to use 1%, 5%, 10%, 50% percentiles to select words. 50% corresponds to all the words in the corpus. The accuracy, shown in Table I, improves as a larger subset of the words is used because the expected sampling follows Bernoulli statistics.
II. EXISTING TEXT TO VECTOR TRANSFORMATION METHODS
A. Word2Vec
Word2Vec is a commonly used method for encoding text for machine learning [7]. In most cases it works better than the earlier bag of words (BOW) approach [12]. However, in the case of small idiomatic vocabularies, the differential in performance is not obvious. Word2Vec can be described as a bag of sacks of words, where each sack contains words that are related to each and describe some concept or idea. When the size of the vocabulary is large, these sacks represent the redundancy in the language. For example, a sack might contain “dog, hound, dogz, dogs, hounds, …, retriever” which are clearly related. This advantage disappears when the vocabulary is small. Word2Vec will converge to either a small number of sacks, where each sack contains most of the vocabulary, or to a large number of sacks where each sack only contains one or two words. In either case the additional information stored in the features is minimal, but the training of Word2Vec could select the most informative set of words.
Instead we decided to use a version of the BOW approach where information theory is used to identify the interesting words. This is admittedly an approximation to the Word2Vec solution with a small vocabulary, but nonetheless useful. Similar, albeit far more complicated approaches, have been used when implementing bag of features (BOF) approaches to image classification and recall [13]. The difference in complexity is due to the requirement of defining regions in image problems, while in this work the regions are simply the words in the text. The “informed bag of words” defines a set of features which references the content of the document and corresponds to the words that used the most differently between the two sources. While we did not implement it for this work, the approach is readily extended to phrases and word patterns.
B. Informed Bag of Words
The derivation of Informed Bag of Words (IBOW) starts from the word frequencies in the data. Let p and q be frequencies or distributions and classes be the number of kinds of objects. The Kullbeck-Leibler divergence P classes plog( p q ) defines an information distance between p and q. A sum like this is relatively useless for machine learning because it does not identify individual words that can be used as features. Instead we select individual objects, i, where pi log( pi qi ) is large relative to other members of the set of objects. These items will be both relatively high probability and more likely in p than in q. We refer to these as interesting objects. Similarly qi log( qi pi ) will be large when q is interesting. If we select objects that are the extremes of the two-tailed divergence pi log( pi qi )−qi log( qi pi ) then we have a set of objects that maximizes the difference between p and q. As both qi and pi must be non-zero in this equation, IBOW works on the intersection of the two data sets.
III. RELATED WORK
The dark web and the social networks used for coordination of criminal activities spans many platforms. Research into these networks combines many disciplines. To the best of our knowledge, no research using the techniques we detail in this paper exists. Thus, we provide a broad overview of the current literature that is most relevant to our work.
In [14], Ghosh et al. present a system called Automated Tool for Onion Labeling (ATOL). This system crawls the Tor network to find hidden “onion” web sites to build a corpus of keywords related to criminal activity. The system can then automatically classify the hidden web sites using Term Frequency Inverse Corpus Frequency (TFICF) and a clustering technique similar to k-Means. The clusters are used for “thematic labeling” of the content of web sites. The themes can be thought of as the overall topic of the web site for which search keywords can be used.
In [15], Tavabi et al. study a large corpus of messages posted to 80 deep and dark web (d2web) forums over a period of more than a year. The study shows how the patterns of discussion evolve and how many forums show similarities in content. Hidden Markov Models (HMM) are used to find latent states between forums. The HMM model also allows for modeling the volatility of the forum content. This is important since the content of the forum may change over time. This could cause the forum to appear to no longer be criminal in nature while still aiding criminal activity.
In [16], Bhalerao et al. propose a graph-based model to discover criminal supply chains. The supply chains are discovered from the English-language “Hack” forums and Russian-language “Antichat” forums. The focus of the paper is commercial postings (similar to the advertisement postings in this paper). An interaction graph of forum activity is built. The graph is defined as G = (U, E), where each node u ∈ U is a user who posts on the forum, and each edge (ua, ub) ∈ E indicates that user ua sold a product to user ub. Forum words are vectorized into their importance ranking using the termfrequency inverse document-frequency (TF-IDF) algorithm. Several classifiers are used for the detection of supply chains.
Finally, in [17], a machine learning model is proposed to classify posts on the Instagram social network related to illegal Internet drug dealing. The authors scrape three months of data from the Instagram web site. A word frequency dictionary is built and used to vectorize the data. Machine learning is applied using a decision tree, random forest, support vector machine, and a LSTM-based deep learning model. Good performance is obtained with all four models.
IV. METHODS
A. The Telegram Environment
Although there is no official listing of the most popular Telegram channels and bots, there are several online tools that claim to find Telegram groups and channels [18], [19], [20], [21], [22], [23]. Telegram chat rooms come in two flavors: channels, primarily used for broadcasting admin approved ads or listings, and groups, primarily used for social interactions or chats. We focused on analyzing groups with no or minimal user restrictions on posting, and open to the public, because they provide the stability of tracking them, and have a fair sample of the actors involved in the topic.
These groups organically emerge primarily in two ways: either a virtually well connected person forms them, and invites many of the contacts to join them, or a group of like-minded people who got introduced to each other through common groups form their own group where they have targeted discussions. The participating actors in these groups mostly do not have physical social ties, their purpose of interactions is to either buy, sale or discuss about goods that are considered illegal to trade in most of the countries. Hence, we found that the types of the messages in these groups could be segregated into two main categories: messages that are intended to either look for or sale specific goods/skill sets – “listings”, and the rest of the messages – “non listings”. We found that the English used in both the types differs significantly. Listings tended to be better phrased and richer in non-alphabetic characters. The non-listings contained English words phrased in non-traditional ways and were shorter in length. However, these Telegram messages differ from popular English used in English speaking countries significantly. This may be because English is not the primary language of most users.
B. Telegram group selection and network expansion
In order to test our methodology, we picked 100 groups discussing financial fraud ranging from cryptocurrency scams, gift card scams, online service scams, stolen credit card information, and so on. These groups may also contain other types of fraud, but the common intersections of these groups is discussion and information pertaining to financial fraud.
The primary way to search for public groups on Telegram is through its native search feature where a key word search renders up-to 3 groups/users/channels if the keyword is a part of the entity’s username string. Since our goal is to understand the groups related to the broad topic of online money scams, we started with getting 5 groups by searching the keywords such as “fullz” , “dumps” and “CVV”. The criteria of picking and expanding on these seed groups was to make sure that the groups had at-least 50 members, had at least a page of recent English messages, had a public Telegram URL and any member was able to post in the group, and the chat histories of which were accessible form the start of the group.
The only way to advertise about Telegram groups is to post the group links in relevant groups where people can join these groups. Hence, after picking the seeds, we searched for unique recent links of other groups that were posted in these groups and successively kept joining these groups until we hit a link that was not valid. We repeated this process with breadth first search strategy.
Despite of automated tools such as Telegram APIs for a network crawl, we stuck to manual crawling of new groups because we wanted a fair sample of the network, where we refrained joining groups that were posted by a single person in the same group, and did a quick sanity check for users that were recently online and were part of this group, and that the group had indeed relevant messages pertaining to financial frauds. Since our goal was to obtain representative groups across the number of members, balance of posts being all listings to all non-listings, and most of the messages being posted by admins to most of the messages being posted in coherent threads by various people, though we crawled 500+ groups in this process, we only included the ones that would pass these goodness criteria. Upon joining the group, we manually downloaded the chat history of these groups.
C. Data Preparation
In Telegram messenger’s chat history, each user’s message is saved as an HTML tag with a unique id. However, if a user posts consecutive messages within a few minutes and without any other user posting a message in between, their second and later messages are appended to their first message. We observed that in most cases, when the the text of the first message is merged chronologically with the texts of its appended messages and considered as a single message block, it conveys a complete sentiment or message in contrast to considering the texts of each of these messages as independent message blocks. Hence, we define a unit message block to be the chronologically ordered texts of a message and its appended messages.
In Telegram chatroom history exports, the users are identified by their non-unique username, and hence we cannot tell the difference between two users with the same username. Hence, for the purpose of this study, we only consider the message block texts as reliable features and ignore all other information from the HTML files. We parsed each group for message block texts. Besides ASCII characters, these messages contain a large variety of UTF-8 and UTF16 characters, including emojis. However, we focus only on English characters. We cleaned the message text by converting to lower case, replacing non-alphabetic characters by spaces and removing single letter words. For each group, we reserved 1/3rd of messages for testing and hence splitting each groups into 2:1 train:test split by picking message indices randomly, so that the chronological order of the messages becomes insignificant. We then build word counters of each group’s training data where we define a word to be space separated set of alphabetic characters. We conclude our data preparation by constructing word Python dictionaries (or hash-tables) which we use to build our models.
By comparing the sizes of train data sets we noticed a huge size imbalance in many cases, and we observed skewed learning in training a binary classifier on training data sets outside of 5 fold range of each-other, hence we only compare the groups whose train data sets are within 5 folds of one another as a preventing measure for skewed learning.
We created/labeled five additional data sets to model questions where NLP techniques are likely to be useful. These questions include distinguishing between bots and normal users, isolating listings, telling legitimate from illicit groups, and distinguishing between different social network agents.
1) bot data set: Bots or chatbots are Telegram accounts that are capable of performing specific administrative tasks, such as printing a welcome message upon joining, printing the user’s name change history, getting the Telegram userid, or noting the missing username, periodically posting a message on behalf of admin, removing users if they post specific keywords etc. Many groups in our data set use bots for a variety of tasks. In order to identify if the message was posted by a bot, we extracted 2664 messages posted by users 19 users among 13 groups that humans identified as bots.
2) listings data set: In order to test if our classifiers distinguish listings [needs to be defined previously] from messages, we created a listings data set comprised of adverts for exchanging illegal goods and services. We did so by adding 58179 message blocks – a month’s data from a group classified by humans as ”listings only” group.
3) legitimate data set: In order to test if our classifiers could identify the illicit groups form legitimate groups, we identified a group that discussed constructs of Python programming language and used its 2,2582 most recent message blocks as our legitimate data set.
4) conversation data set: In order to test if our classifiers could differentiate between conversations and a mix of conversations and listings, we identified a group with 2664 message blocks whose purpose was to discuss how-tos for network attacks, and used it as conversation data set.
5) twitter data set: We wanted to measure how the language of Telegram differs from that of the contemporary popular English. In particular, can our models distinguish between current twitter English and Telegram English? In order to test this, we picked English tweets for a random day in past 1 year and randomized the tweets to create this data set.
D. Language Model In order to evaluate the language model, we defined a series of test systems. The first and primary test was to see if the model could discriminate between one Telegram channel and another. Since we had identified and scraped 102 different channels, this gives 5253 unique combinations of channels which is enough to derive meaningful statistics for the quality of the model. We evaluated pairs of channels to maintain balanced or nearly balanced data sets. It typically took about three hours of time to run five fold cross validation on all unique pairs without GPU enhancement with a 1% percentile cutoff for the words and twelve hours with 50% (which used all the words).
The second test was to distinguish between regular human users and bots or automatic users. We manually extracted bot messages and compared them to random selections of human messages.
The third test was to compare advertisements or listings with conversational messages. We assayed this both by comparing channels that were almost entirely listings with normal channels and extracting an “ad” data set and comparing that with comparably sized random selections of conversations.
 Fig. 1: A histogram of the relative entropy vs. count for the Python group and an illicit group. The words shown are those that are significant at the 1% percentile cutoff. The information metric has clearly identified the difference between the two groups. The red vertical line shows the median.
Fourth, we compared a Python programming channel, which is a sample of non-criminal activity, with our “illicit” channels to show that we could discriminate between licit and illicit activity, and finally, we compared Telegram messages to Twitter messages.
After creating word counters from the training data for each of the data sets, we compared all groups among the same datalength component of all the groups falling into 5 fold range of the size of their training data. for the cases of legitimate, bots, listings and twitter data set, we compared as many lines of the smallest data set. Given two groups, the goal here is to identify relatively high entropy words that make better features. In order to achieve this goal, we paired all groups with other unique groups and compared all the common words of the pair by calculating relative entropies. We then picked 1, 5, 10, 50% of words on each end of the distribution generating three lists of high entropy words. We used these words as the dictionary words for encoding each message block, thereby creating four different types of train-test vectors. For each pair of groups, we then trained the same classifier with the same hyper-parameters for each of these train vectors to compare how much fluctuation in accuracy, precision, recall, sensitivity or specificity, F1 score, and Matthew’s correlation coefficient was observed.
E. Encoding Features
Embedding techniques like Word2Vec [7], Doc2Vec [8], and Paragraph2Vec [24] project the words in a document onto a set of vectors of similar words. Unfortunately, the small size and idiomatic nature of the vocabulary in the Telegram messages tends to obviate the advantage of this approach. The word vectors would be much shorter than the 100 or so typically used in Word2Vec to represent a single concept. Bots, for example, often have a total vocabulary that is much smaller than 100 words, so reducing them to typical Word2Vec sizes is impractical at best. Similarly, consistent misspellings and non-standard usage is characteristic of some of the Telegram users. Consistent use of “ur” instead of “your” is a useful feature for identifying a user or channel, which the vector of words, alternate spellings, and synonyms in Word2Vec would hide.
 Fig. 2: A histogram of the accuracy vs. count for classifiers of all distinct group pairs built with 10% percentile of the words. As expected, it neatly follows a β distribution.
 Fig. 3: A histogram of the Matthew’s correlation vs. count for classifiers of all distinct group pairs built with 10% of the words.
F. Control Calculations
In order to measure the effectiveness of IBOW as a sentence embedding, we compare IBOW with Doc2vec [24] sentence embedding and TF-IDF [25], [26], [27]. For Doc2Vec we treated each message block as a document and provided a document id as the message block number. We ran Doc2Vec with the gensim [28] library implementation with distributed memory for 200 iterations, with linear decrease of learning rate from 0.03 to 0.01 and vector size 52. We used sci-kit learn’s [29] TfidfVectorizer with l2 normalization and without a threshold to build the TF-IDF model in this study. Thus in our study the TF-IDF model used far more features than the IBOW model (see Figure 4).
G. Experimental Details
With word dictionaries for p = 1, 5, 10 and 50, we vectorized training message blocks as ordered word counters for each pair of the groups. To study the goodness of this feature selection method, we train three different binary classifiers for the same training vectors: logistic regression and 1 layered artificial neural network (ann) capped by 200 iterations and adaboost with 100 solvers. For ann, we use 100 neurons with stochastic gradient decent and constant learning rate 0.01. None of the hyper-parameters are tuned for any specific group-pair, pr threshold values, rather, the hyper-parameters are chosen to be smallest but generally optimal for many groups. We conducted the experiments with Python 3.7 on an 8core double-threaded i7 3.6GHz machine. We used numpy 1.18 [30], [31] with random seed 0 to process the data and scikit learn 0.23 [29] with random seed 0 to build the models. The Matthew’s correlation coefficient is a good alternative to F1 scores and ROC curves [32] for representing training quality. The accuracy and Matthew’s Correlation coefficient are defined:

where TP is True Positive, TN is True Negative, FP is False Positive, and FN is False Negative.
V. RESULTS
Our results are comparable with state of the art algorithms on these data. Table I shows the mean and standard deviations as a function of algorithm and percentile. Figure 1 shows an example of the distribution of words for Python vs an illicit group with respect to the relative entropy measure. Most of the words near the median are not informative, and even the 1% percentile shows meaningful differences in the features. It is clear from the words shown in Figure 1 that the Python group is mostly concerned with helping solve programming errors and the other group about credit cards. Figure 2 shows the distribution of the accuracy and Figure 3 the Matthew’s correlation coefficient when all groups are trained against all other groups in the data with a 10% percentile with an ANN. The TP rate vs FP rate is shown for a typical criminal group in figure 7. This figure shows the effect of percentile of data used on the reliability of the machine learning model. In order to summarize the results, the histograms show the counts over all 5253 unique pairs. The distributions follow a β distribution, which expected for random errors when the minimum and maximum values are constrained to a range. Generally speaking there is not a large difference between using the 10% percentile and the 50% percentile. Using more data in the model, not unsurprisingly, improves the results, but most of the improvement is seen early on.
The Figures 6, 9, and 11 show our the accuracy of our results on different kinds of data. The corresponding Figures 8, 10, and 12 show the corresponding Matthew’s correlation coefficient. Five-fold cross validation was run on many individual runs and the figures show a histogram of the relevant statistic. Since the choice of percentile cutoff is arbitrary each row in the figures shows a different value of the percentile. As expected, the distributions have less spread and move towards the right as the fraction of data used is increased.
A. Comparison with TF-IDF and Doc2Vec
TF-IDF is based on a probabilistic model of word occurrence in text [27], [26]. There have been efforts to place it on an information theoretical basis [25] and the information theoretical basis resembles the IBOW approach. The major difference between IBOW and TF-IDF is that TF-IDF uses the Kullback-Leibler divergence for the probability of the document given the word, while IBOW uses a two-tailed Kullback-Leibler divergence for the relative probability of the word in two sets of documents. In its classic formulation TFIDF identifies weights based on word frequencies corrected for the frequency of the word in a set of documents. These weights are then used as a linear discriminator for classification. As such TF-IDF uses the union of the words in the total corpus as a feature set unless a threshold is set. The threshold corresponds to IBOW’s choice of percentile.
Comparison of the accuracy of IBOW with TF-IDF and Doc2Vec is shown in Figure 5. Both TF-IDF and IBOW are significantly better than Doc2Vec, and TF-IDF, as run, is slightly better than our approach. That TF-IDF is better is not surprising as TF-IDF uses far more features than IBOW as shown in Figure 4. IBOW generates nearly the same accuracy as TF-IDF with at least ten times less features which shows that its linguistic model effectively captures the essential feature of the conversation. Using so many more features to receive a few percent better accuracy violates the economy of features which is important for performance with big data. Doc2Vec, in addition to being less accurate than either TFIDF or IBOW, is significantly slower and averages 20 or more CPU minutes per trial where the other approaches use less than a minute. These data are summarized over a large (1689 samples) and representative subset of the one group vs another test set. The CPU requirements for Doc2Vec limited the size of the test. The machine learning was done with Logistic Regression to eliminate the effects due to differences tuning meta-parameters in Adaboost and ANN.
 Fig. 4: A histogram of the number of TF-IDF words divided by the number of words in our approach. The data for the 10% percentile in IBOW is shown.
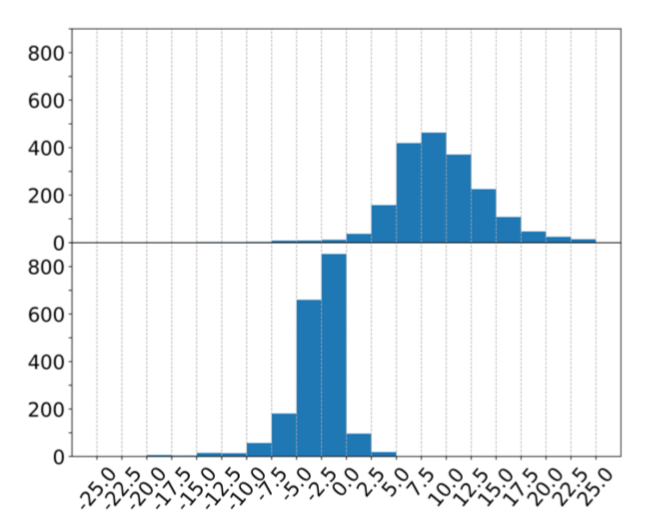 Fig. 5: A histogram of relative accuracy of our method (10% percentile). The upper panel shows IBOW-Doc2Vec and the lower panel shows IBOW-TF-IDF. Positive numbers are where IBOW is better.
B. Bot Detection
Bot messages vary between highly repetitive messages, such as “Welcome to the group” and more complex messages where the group administrator uses the bot to post an announcement. However, even in the more complex messages, the language is highly formatted and relatively rigid with respect to humanbased chats. The distributions shown in Figures 6 and 8 demonstrate that reasonable accuracies can be found even with fairly small numbers of words (1% percentile). The Matthew’s coefficient shows that using more words improves the balance between FN and FP predictions.
C. Listing Detection
Listings or ads are less repetitive than bot messages. Since they are written by members of the community they more difficult to distinguish from chats because the linguistic features of a listing and a chat written by the same person will be highly similar. Figure 9 shows the distribution of accuracy and it is not as good as the bot example (Figure 6). The Matthew’s correlation, Figure 10, shows a wider spread than that seen with bots as well.
neural network.png
 Fig. 6: A histogram of the cross-validated accuracy of the deciding whether a message came from a bot or a human. Each row shows the dependence on the percentile of the data used.
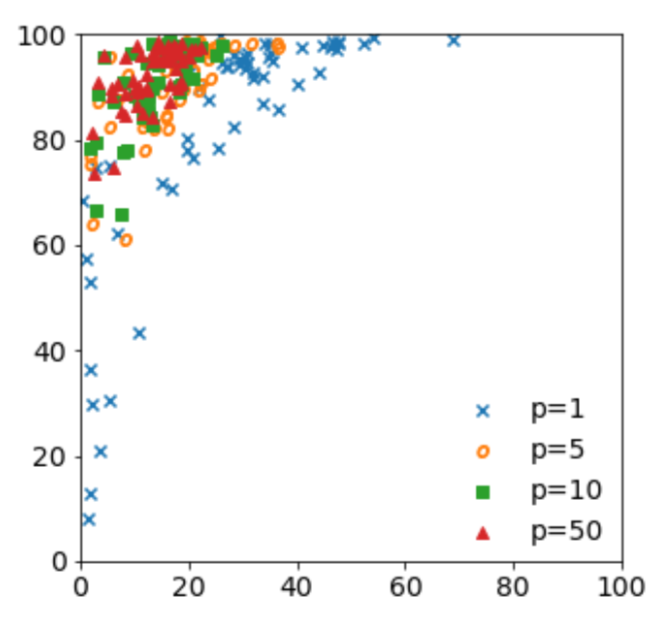 Fig. 7: A scatter plot of a typical criminal group with respect to other criminal groups. The data of 1, 5, 10 and 50 percentile with false positive messages as x axis and true positive messages as y axis, obtained by artificial neural network. The figure shows that the reliability of the model increases as the percentile of data is increased.
D. Group Comparisons
The overall comparison of groups, all 5253 pairs, is shown in Figures 2 and 3. More interesting, from a sociological perspective is the accuracy at determining whether a group was one centered on bank fraud or other illicit activity or one centered on a normal activity. Since many of the Telegram groups have misleading names, for example one on “puppies” being images of dog-fighting, we chose a Python programming group as a control set. We could quickly verify that the Python group was on programming and not snakes. Another similar control was to establish if a message came from Telegram or the similar social networking site, Twitter.
neural network.png
 Fig. 8: A histogram of the Matthew’s correlation coefficient of the deciding whether a message came from a bot or a human. Each row shows the dependence on the percentile of the data used.
neural network.png
 Fig. 9: A histogram of the cross-validated accuracy of the deciding whether a message was a listing or a conversation. Each row shows the dependence on the percentile of the data used.
1) Python vs. Illicit: Figure 1 shows the distribution of words for Python vs a similar sized bank fraud chat group. Interestingly, even at 1% percentile, the words show a humancomprehensible difference. This demonstrates that IBOW can be used to develop human comprehensible machine learning models. The Python group, in addition to the word “Python”, includes Python language terms (e.g. “self”, “list”) and words that describe the kinds of conversations (“help”, “code”, “error”). The words in the Python group are clearly literate and avoid slang. The bank fraud group has distinctive slang (“bro”, “lol”, “ur”), and content (“card”, “address”, “mac”). The two groups also differ in their use of “low information” words like “and”, “you”, “in”, and “ok”. Figure 11 shows the distribution of the accuracy and Figure 12 distribution of the Matthew’s coefficient for Python vs illicit chats. Again, increasing the number of words has a larger effect on the Matthew’s coefficient than the accuracy.
neural network.png
 Fig. 10: A histogram of the Matthew’s correlation coefficient of the deciding whether a message was a listing or a conversation. Each row shows the dependence on the percentile of the data used.
2) Twitter vs Telegram: Figure 13 shows the distribution of accuracy when Twitter data were compared to Telegram data. The quality of classification was much higher than with Telegram vs Telegram, so we only present the 10% percentile here. All tweets from a random day, September 23 2019, were downloaded from twitter dumps. Tweets were selected that were in English, more than two million, and processed in the same manner as the Telegram data. Random balanced subsets of the processed Twitter data were used to ensure that the machine learning reflected the accuracy of the model rather were due to imbalanced data.
VI. CONCLUSIONS
A. Summary
Our work shows that a relatively simple and economical algorithm, based on a two-tailed Kullback-Leibler divergence, determines a set of features that accurately classify short idiomatic messages. The algorithm is economical both in memory use and computer processing time, which makes it eminently suitable for big data problems.
neural network.png
 Fig. 11: A histogram of the cross-validated accuracy of the deciding whether a message came from a Python channel or an illicit one. Each row shows the dependence on the percentile of the data used.
neural network.png
 Fig. 12: A histogram of the Matthew’s correlation coefficient of the deciding whether a message came from a Python channel or an illicit one. Each row shows the dependence on the percentile of the data used.
We successfully classified the originating group of 5,253 pairs of Telegram chats, distinguished bot messages from human ones, identified listings or advertisements, and identified human comprehensible differences between illicit conversations and Python programming conversations. Our approach also could identify the difference between social networking entities, distinguishing Twitter from Telegram. The approach is considerably more accurate than embedding algorithms like Doc2Vec on this kind of data. It is also much faster than Doc2Vec. It is a little less accurate than TF-IDF, but uses far fewer features.
 Fig. 13: A histogram of the cross-validated accuracy of the deciding whether a message came from a Telegram channel or Twitter. The 10% percentile was used for this figure.
B. Future Work
Future work includes extending the algorithm to handle phrases and sets of words. This should improve the accuracy while keeping the efficiency. However, it may require an extra unsupervised machine learning step to extract the most meaningful phrases much as is used in embedding algorithms. Combinations of this approach with embedding, at least at the word level, could be useful for larger and longer documents. We could also explore the use of an “inverse document frequency”, the IDF in TF-IDF, to improve accuracy. Finally, the work should be extended to include non-literary features, such as emojis and non-ASCII UTF-8 and UTF-16 characters.
 TABLE I: The accuracy (in percentage) and Matthew’s correlation coefficient for Logistic Regression, Adaboost and ANN, and percentiles of the data. The ANN is the best algorithm, but the difference is not large and within the observed variance. The difference between 10% and 50% is small compared to the increase in the work required.
VII. ACKNOWLEDGEMENTS
Parts of this work were supported by the Evidence-Based Cyber-Security group (EBCS) at Georgia State University.
REFERENCES
D. Maimon, Y. Wu, N. Stubler, and P. Sinigirikonda, “Extended validation in the dark web: Evidence from investigation of the certification services and products sold on darknet markets,” 2020.
P. Wang, X. Liao, Y. Qin, and X. Wang, “Into the deep web: Understanding e-commerce fraud from autonomous chat with cybercriminals,” in NDSS, 2020.
R. A. HARDY and J. R. NORGAARD, “Reputation in the internet black market: an empirical and theoretical analysis of the deep web,”* Journal of Institutional Economics*, vol. 12, no. 3, p. 515539, 2016.
O. Babko-Malaya, R. Cathey, S. Hinton, D. Maimon, and T. Gladkova, “Detection of hacking behaviors and communication patterns on social media,” in 2017 IEEE international conference on big data (Big Data). IEEE, 2017, pp. 4636–4641.
W. Sayers, “Cant, rant, gibberish, and jargon,” ANQ: A Quarterly Journal of Short Articles, Notes and Reviews, vol. 28, no. 1, pp. 1–10, 2015.
J. P. Considine, Small dictionaries and curiosity: Lexicography and fieldwork in post-medieval Europe. Oxford University Press, 2017.
Y. Goldberg and O. Levy, “word2vec explained: deriving mikolov et al.’s negative-sampling word-embedding method,” arXiv preprint arXiv:1402.3722, 2014.
J. H. Lau and T. Baldwin, “An empirical evaluation of doc2vec with practical insights into document embedding generation,” in Proceedings of the 1st Workshop on Representation Learning for NLP, 2016, pp. 78–86.
A. Pak and P. Paroubek, “Twitter as a corpus for sentiment analysis and opinion mining.” in LREc, vol. 10, no. 2010, 2010, pp. 1320–1326.
E. Kouloumpis, T. Wilson, and J. Moore, “Twitter sentiment analysis: The good the bad and the omg!” in Fifth International AAAI conference on weblogs and social media. Citeseer, 2011.
A. Agarwal, B. Xie, I. Vovsha, O. Rambow, and R. J. Passonneau, “Sentiment analysis of twitter data,” in Proceedings of the workshop on language in social media (LSM 2011), 2011, pp. 30–38.
R. Zhao and K. Mao, “Fuzzy bag-of-words model for document representation,” IEEE Transactions on Fuzzy Systems, vol. 26, no. 2, pp. 794–804, 2018.
S. Lazebnik and M. Raginsky, “Supervised learning of quantizer codebooks by information loss minimization,” IEEE Transactions on Pattern Analysis and Machine Intelligence, vol. 31, no. 7, pp. 1294–1309, 2009.
S. Ghosh, A. Das, P. Porras, V. Yegneswaran, and A. Gehani, “Automated categorization of onion sites for analyzing the darkweb ecosystem,” in Proceedings of the 23rd ACM SIGKDD International Conference on Knowledge Discovery and Data Mining, 2017, pp. 1793–1802.
N. Tavabi, N. Bartley, A. Abeliuk, S. Soni, E. Ferrara, and K. Lerman, “Characterizing activity on the deep and dark web,” in Companion Proceedings of The 2019 World Wide Web Conference, 2019, pp. 206– 213.
R. Bhalerao, M. Aliapoulios, I. Shumailov, S. Afroz, and D. McCoy, “Mapping the underground: Supervised discovery of cybercrime supply chains,” in 2019 APWG Symposium on Electronic Crime Research (eCrime). IEEE, 2019, pp. 1–16.
J. Li, Q. Xu, N. Shah, and T. K. Mackey, “A machine learning approach for the detection and characterization of illicit drug dealers on instagram: model evaluation study,” Journal of medical Internet research, vol. 21, no. 6, p. e13803, 2019.
“Telegram groups: A list of 350+ groups in english,” https:// telegramchannels.me/groups, (Accessed on 08/18/2020).
“1000+ best telegram group link 2020 (search to join a chat),” https: //telegramguide.com/telegram-group-link/, (Accessed on 08/18/2020).
“8000+ telegram channels, groups, bots and stickers list,” https:// telegramchannels.me/, (Accessed on 08/18/2020).
“Telegram group: Find telegram channels, bots & groups,” https://www. telegram-group.com/en/, (Accessed on 08/18/2020).
“Top telegram groups,” https://combot.org/telegram/top/groups, (Accessed on 08/18/2020).
“United states telegram group link search — us tg list,” https://www. hottg.com/telegram-group/us, (Accessed on 08/18/2020).
Q. Le and T. Mikolov, “Distributed representations of sentences and documents,” in International conference on machine learning, 2014, pp. 1188–1196.
A. Aizawa, “An information-theoretic perspective of tf–idf measures,” Information Processing & Management, vol. 39, no. 1, pp. 45–65, 2003.
H. C. Wu, R. W. P. Luk, K. F. Wong, and K. L. Kwok, “Interpreting tf-idf term weights as making relevance decisions,” ACM Trans. Inf. Syst., vol. 26, no. 3, Jun. 2008. [Online]. Available: https://doi.org/10.1145/1361684.1361686
S. Robertson, “Understanding inverse document frequency: on theoretical arguments for idf,” Journal of documentation, 2004.
R. Reh ˇ u˚ˇrek and P. Sojka, “Software Framework for Topic Modelling with Large Corpora,” in Proceedings of the LREC 2010 Workshop on New Challenges for NLP Frameworks. Valletta, Malta: ELRA, May 2010, pp. 45–50, http://is.muni.cz/publication/884893/en.
F. Pedregosa, G. Varoquaux, A. Gramfort, V. Michel, B. Thirion, O. Grisel, M. Blondel, P. Prettenhofer, R. Weiss, V. Dubourg, J. Vanderplas, A. Passos, D. Cournapeau, M. Brucher, M. Perrot, and E. Duchesnay, “Scikit-learn: Machine learning in Python,”* Journal of Machine Learning Research*, vol. 12, pp. 2825–2830, 2011.
T. E. Oliphant, A guide to NumPy. Trelgol Publishing USA, 2006, vol. 1.
S. Van Der Walt, S. C. Colbert, and G. Varoquaux, “The numpy array: a structure for efficient numerical computation,” Computing in Science & Engineering, vol. 13, no. 2, p. 22, 2011.
D. Chicco and G. Jurman, “The advantages of the matthews correlation coefficient (mcc) over f1 score and accuracy in binary classification evaluation,” BMC Genomics, vol. 21, p. 6, 2020.